Chapter 5: Changes in Snowpack, Soil Moisture & Fuel Moisture
Data Overview
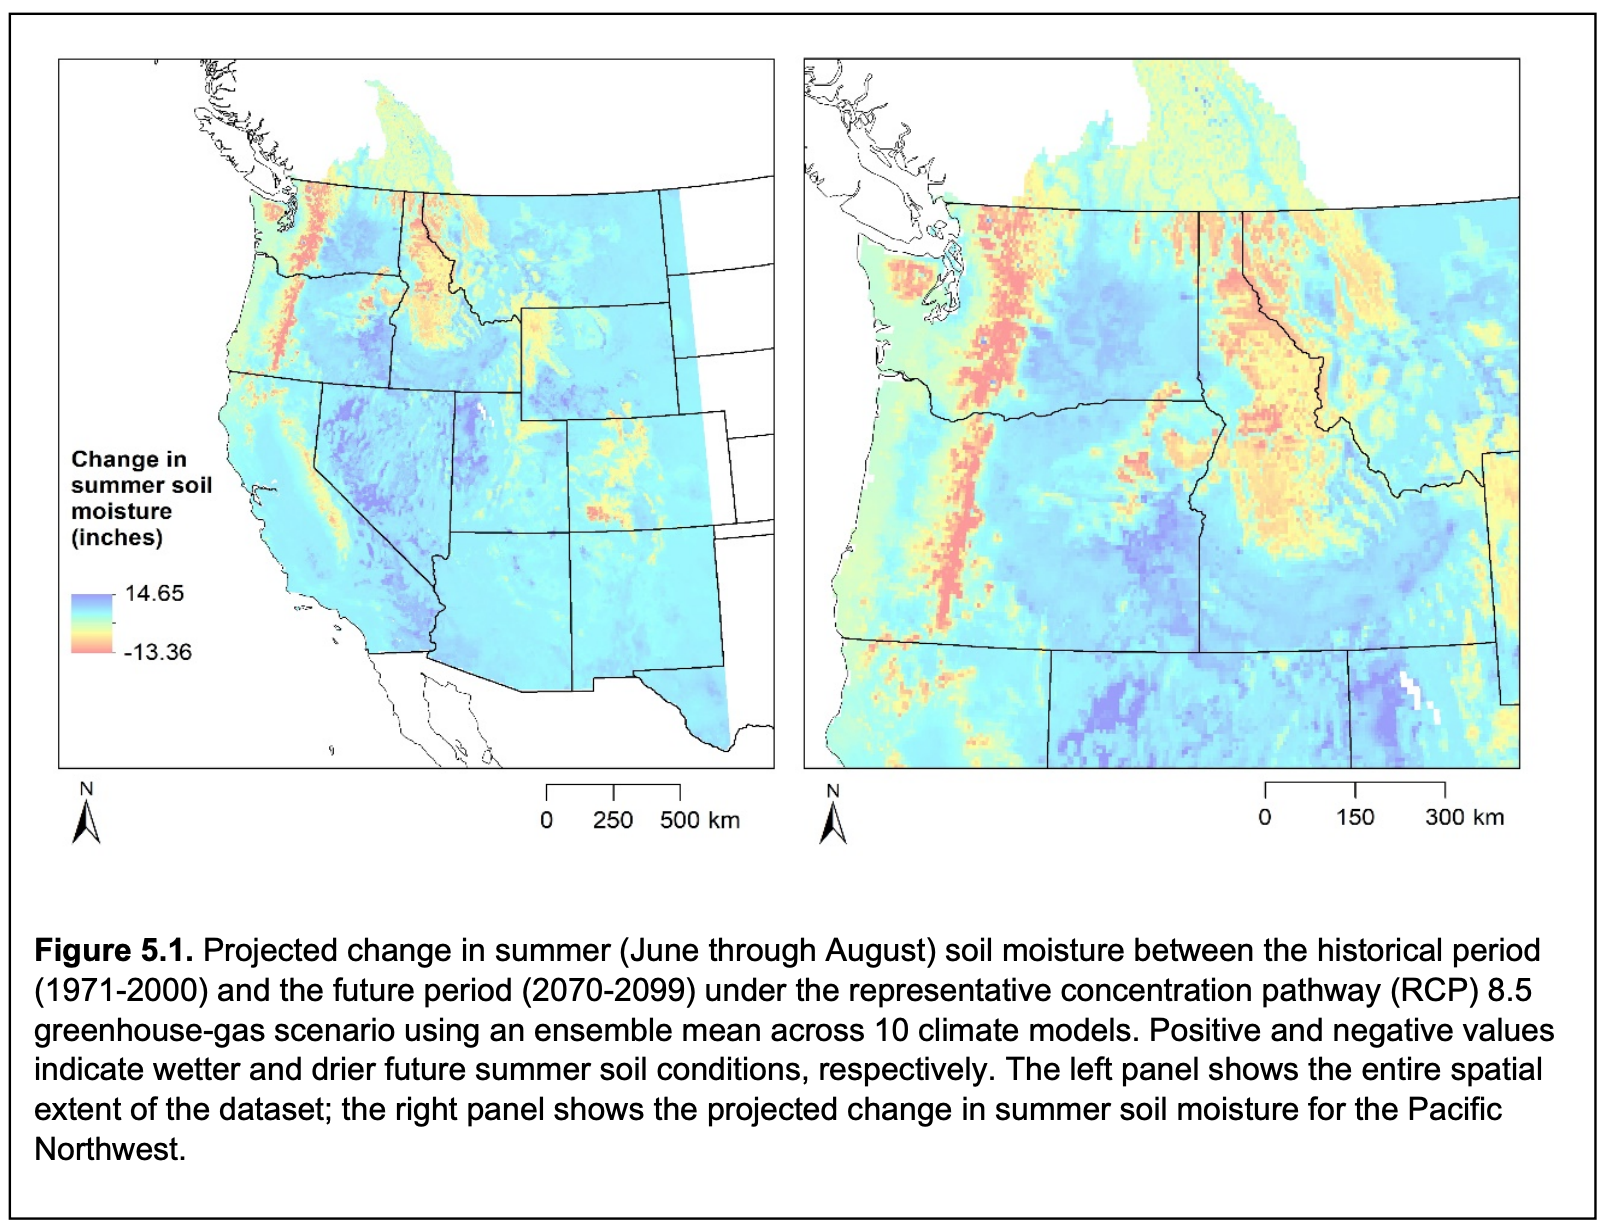
This dataset contains future projections of snowpack (represented as snow-water equivalent, or SWE), soil moisture (figure 5.1), and dead-fuel moisture (DFM), which is an indicator of fire potential (see chapter glossary for definitions of terms). Soil moisture projections are available on a seasonal basis (e.g., June through August). Projections of SWE are available for the first day of each month from November 1st to May 1st. DFM is projected for 100-hour fuels and 1000-hour fuels. These data layers were produced using hydrologic simulations from the variable infiltration capacity (VIC) model that were driven by downscaled climate model outputs of precipitation, maximum and minimum temperature, and wind speed. The data layers are all closely related based on hydrologic processes. For example, in areas where April 1st SWE is projected to decline, these snowpack reductions early in the growing season translate into drier soils in summer that may correspond to drier fuels and thus greater fire potential.
Data Access: https://climate.northwestknowledge.net/IntegratedScenarios/vis_summarymaps.php
Conservation Applications
Potential conservation applications of this dataset could include the following:
- The data layers in this dataset could be used to predict several types of hydrologic and ecological changes. For example, locations projected to experience more extreme decreases in summer soil moisture and dead-fuel moisture might be more prone to droughts and wildfires—and the ecological consequences of those types of disturbances—relative to locations projected to have moderate declines or increases in these moisture variables. Watersheds where dramatic declines in snowpack are projected might be expected to experience changes in streamflow that could affect aquatic species.
- This dataset is provided through the "Integrated Scenarios of the Future Northwest Environment" website. This project presents these hydrologic projections together with climate and vegetation projections and provides several user guides that could be helpful to conservation practitioners. For example, this website provides a tool that guides the user through a series of simple questions and provides advice as to the types of data, visualization products, and analysis that are recommended. For users that are interested in specific locations or areas, the website can produce custom scatterplots, boxplots, and streamflow projections.
Applicable scales for detailed spatial assessments:
- For conservation applications requiring detailed assessment of spatial variation of the dataset within a geographic boundary (such as a protected area), the following geographic scales may be most appropriate (see appendix 3 for more information).
- At the scale of: a level-3 ecoregion (e.g., the North Cascades), a single state (Washington, Oregon, or Idaho), a region (multiple states in the Pacific Northwest or in western North America).
Applicable scales for assessing general patterns:
- Due to spatial resolution, the dataset may not show detailed spatial variation at the following geographic scales, however, the dataset may be useful to assess general patterns or for comparison to other locations (see appendix 3 for more information).
- At the scale of: a small (<1 km2) nature preserve, a state park or state wildlife area, a local watershed (12-digit hydrologic unit code [HUC-12]), a Bureau of Land Management (BLM) district, a river watershed (8-digit hydrologic unit code [HUC-8]), an individual county, a national forest.
Use of the dataset in conservation applications may be limited by the following considerations:
- The spatial resolution of the dataset (1/16°) is fairly coarse, such that the dataset cannot be used to resolve spatial variation in the variables of interest for small protected areas. In particular, microscale and even medium-scale variation in soil moisture based on different soil characteristics (e.g., well-drained versus poorly drained soil) and topographic characteristics (e.g., warmer south-facing slopes versus cooler north-facing slopes) cannot be mapped or explored with these data layers. In addition, because climate models disagree somewhat in their projections of future precipitation patterns, use of these data layers to predict hydrologic and ecological changes should be informed by an understanding of the uncertainties surrounding model projections.
Past or current conservation applications:
- The dataset has not yet been used in any on-the-ground conservation applications to the knowledge of the authors of this chapter.
Dataset citation:
Gergel, D. R., B. Nijssen, J. T. Abatzoglou, D. P. Lettenmaier, and M. R. Stumbaugh. 2017. Effects of climate change on snowpack and fire potential in the western USA. Climatic Change 141:287–299.
Dataset documentation link:
https://doi.org/10.1007/s10584-017-1899-y (subscription or fee required)
Data access:
Projections for SWE and soil moisture can be queried, viewed interactively, and downloaded from: https://climate.northwestknowledge.net/IntegratedScenarios/vis_summarymaps.php
Projections for dead-fuel moisture may be obtained from the corresponding author.
Metadata access:
Formal metadata is not available for this dataset.
Dataset corresponding author:
Diana R. Gergel
Department of Civil and Environmental Engineering, University of Washington
[email protected]
Data type category (as defined in the Introduction to this guidebook): Climate, fire, hydrology
Species or ecosystems represented: This dataset does not represent any particular species or ecosystems.
Units of mapped values:
Snow-water equivalent: inches (in.)
Soil moisture: in.
Dead-fuel moisture: percent
Range of mapped values: Ranges of values depend upon the variable, the season selected, the time period of analysis, the choice of greenhouse-gas scenario, and the choice of climate model (or ensemble across climate models). For example, for summer (June through August) soil-moisture projections for 2070-2099 under the RCP 8.5 scenario using a mean across the 10 available climate models, the range of values is roughly 0 to 40 inches.
Spatial data type: a raster dataset (grid)
Data file format(s): GeoTiff (.tif), NetCDF (.nc), web map service
Spatial resolution: 1/16°
Geographic coordinate system: World Geodetic System (WGS) 1984
Spatial extent: Regional
Dataset truncation: The dataset is truncated along the United States borders with Canada and Mexico (except for the Pacific Northwest) and along a longitudinal line east of the eastern borders of Montana and Wyoming (103°W).
Time periods represented: Control (1960-2005), historical (1971-2000); future (2010-2099)
Future time period(s) represented: Early 21st century (2010-2039), mid-century (2040-2069), end-of-century (2070-2099).
Baseline time period (against which future conditions were compared): 1971-2000.
Methods overview:
The VIC hydrologic model (Liang et al. 1994) was used to simulate hydrologic processes for the western United States. With meteorological inputs consisting of downscaled climate model outputs, including precipitation, wind speed, and minimum and maximum temperature, the model produces estimates of various fluxes (movements) of energy and water as well as estimates of hydrologic state variables such as SWE and soil moisture. Downscaled outputs from 10 climate models and corresponding hydrologic model simulations were combined to create future projections of SWE, soil moisture, dead-fuel moisture, as well as dynamic processes such as snow melt, evapotranspiration, and runoff into streams. Dead-fuel moisture was calculated using the National Fire Danger Rating System (NFDRS) algorithm for calculating fuel moisture (Cohen and Deeming, 1985). For more information, please consult the dataset citation listed in section 2 of this chapter.
This dataset relied on the following general types of models: Hydrologic models, climate models
This dataset employed the following specific models: Variable infiltration capacity (VIC) model (Liang et al. 1994).
Major input data sources for this dataset included: Historical climate observations or models, future climate projections, streamflow data or other hydrologic data
This dataset used the following general circulation models (GCMs): BCC-CSM1-1-M, CanESM2, CCSM4, CNRM-CM5, CSIRO-Mk3.6.0, HadGEM2-CC365, HadGEM2-ES365, IPSL-CM5A-MR, MIROC5, NorESM1-M
Separate files are provided for each GCM and an ensemble across GCMs is also provided. More information about climate models is available in appendix 1. Detailed information about climate models, including model evaluation and comparison among models, is available from Randall et al. (2007) and Rupp et al. (2013).
This dataset used the following greenhouse-gas scenarios: RCP 4.5, RCP 8.5
More information about greenhouse-gas scenarios is available in appendix 2 and from Knutti and Sedláček (2013).
Creation of this dataset involved the following methods to change the spatial resolution of climate models (e.g. to downscale or resample climate models): The Multivariate Adaptive Constructed Analogs (MACA) downscaling method was used (Abatzoglou and Brown, 2012).
The mapped values of the dataset may be interpreted as follows:
Higher values of SWE indicate greater mountain snowpack at a particular time in the season, e.g., higher April 1st SWE indicates greater snowpack on April 1st. Lower values of soil moisture for an individual season (e.g., summer) indicate drier soils; higher values indicate wetter soils. Similarly, lower values of fuel moisture indicate drier fuel conditions that may be more conducive to the occurrence of fires. For all variables, differences between historical and future time periods are positive for increases and negative for decreases.
Representations of key concepts in climate-change ecology:
This dataset primarily represents components of climate-change exposure related to watershed hydrology (SWE and soil moisture) and potential fire dynamics (fuel moisture). As discussed in chapter 4, projected changes in snowpack represent important linkages between changing climate conditions and effects on species and ecosystems in certain parts of the Pacific Northwest, such as mountainous areas. Changes in soil and fuel moisture have potential consequences across a range of ecosystems and at a range of elevations.
The components of this dataset can be considered together to assess multiple facets of climate-change exposure for a given area. For example, areas that are projected to experience reduced April 1st SWE may also have drier summer soils and drier fuels that can increase wildfire potential. Species inhabiting these areas might thus be faced with multiple manifestations of climate-change exposure simultaneously, which can be an important consideration in assessing overall climate-change vulnerability. Other considerations not addressed by this dataset include the possibility that different species or ecosystems may respond differently to these forms of climate-change exposure, such as by having different sensitivities to changing watershed hydrology or different capacities to adapt to changing soil and fire dynamics.
This dataset involves the following assumptions, simplifications, and caveats:
The VIC model uses climate model projections as inputs. Although all climate models agree that temperatures will increase, there is substantial variability in precipitation projections among climate models. As a result, in some areas (such as the Northern Cascades) the spread in projected change of April 1 SWE across climate models is substantially larger than the mean projected change (see figure 3 in Gergel et al. 2017). This means that, for these locations, projections of change in April 1 SWE can be very different from one climate model to another, translating to substantial uncertainty concerning those SWE projections. Similarly, different climate models produce different projections of soil moisture, especially in lowland areas, and some models show increases in dead-fuel moisture in some areas while other models show decreases in dead-fuel moisture in other parts of the western United States.
Quantification of uncertainty:
In the study that produced these data layers (Gergel et al., 2017), uncertainty was quantified by examining patterns across the 10 climate models (GCMs) that were used and the spread in the ensemble of hydrologic model simulations with different climate models. For example, uncertainty in SWE projection was mapped across the landscape by dividing the range of future April 1 SWE across climate models by the ensemble-mean projected change in SWE. For the dead-fuel moisture projections, the number of climate models showing increases (wetter fuels) was compared to the number of models showing decreases (drier fuels).
Field verification:
Field verification of the mapped values in this dataset was not possible because the dataset represents a future condition. Simulated historical SWE values from the VIC model were compared to observed SWE records from SNOTEL sites (see supplementary files in Gergel et al., 2017).
Prior to dataset publication, peer review was conducted by external review (at least two anonymous reviewers, each from different institutions).
Abatzoglou, J. T., and T. J. Brown. 2012. A comparison of statistical downscaling methods suited for wildfire applications. International Journal of Climatology 32:772–780.
Cohen, J., and D. Deeming. 1985. The National Fire Danger Rating System: basic equations, Gen Tech Rep PSW-82. USDA Forest Service, Pacific Southwest Forest and Range Experiment Station, Albany, CA.
Gergel, D. R., B. Nijssen, J. T. Abatzoglou, D. P. Lettenmaier, and M. R. Stumbaugh. 2017. Effects of climate change on snowpack and fire potential in the western USA. Climatic Change 141:287–299.
Knutti, R., and J. Sedláček. 2013. Robustness and uncertainties in the new CMIP5 climate model projections. Nature Climate Change 3:369–373.
Liang, X., D. P. Lettenmaier, E. F. Wood, and J. Burges. 1994. A simple hydrologically based model of land surface water and energy fluxes for general circulation models. Journal of Geophysical Research 99:14415–14428.
Randall, D., R. Wood, S. Bony, R. Colman, T. Fichefet, J. Fyfe, V. Kattsov, and et al. 2007. Cilmate models and their evaluation. in S. Solomon, D. Qin, M. Manning, Z. Chen, M. Marquis, K. Averyt, M. Tignor, and H. Miller, editors. Climate Change 2007: The Physical Science Basis. Contribution of Working Group I to the Fourth Assessment Report of the Intergovernmental Panel on Climate Change. Cambridge University Press, New York, NY.
Rupp, D. E., J. T. Abatzoglou, K. C. Hegewisch, and P. W. Mote. 2013. Evaluation of CMIP5 20th century climate simulations for the Pacific Northwest USA. Journal of Geophysical Research 118: 884–907.