Chapter 3: North American Climate Refugia
Dataset Overview
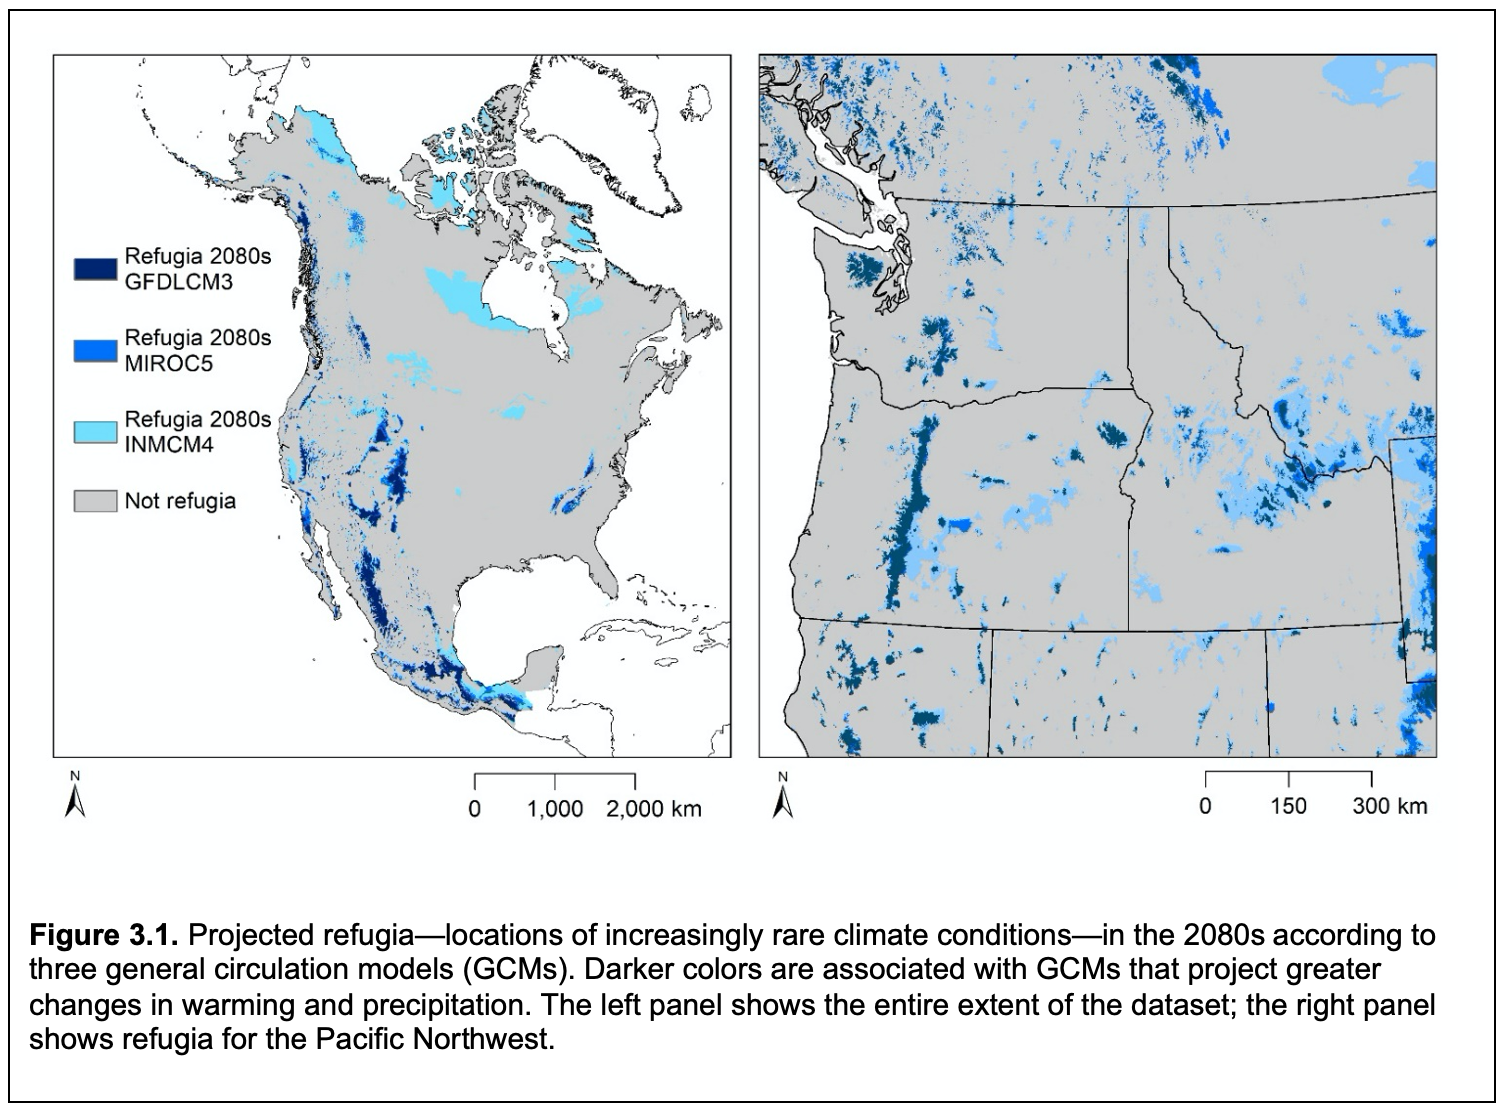
This dataset represents potential climatic refugia (figure 3.1), defined as locations with future climatic conditions that are increasingly rare compared to their historical extent (see chapter glossary for definitions of terms). This dataset relies on the concept of climate analogs, which were identified by comparing current climate conditions to projected future climate conditions using two multivariate measures of climate. Locations (i.e., pixels) with at least 25% fewer climate analogs in the future than were present historically, within a given search radius, were deemed to represent increasingly rare climate conditions, and hence delineated as refugia (Michalak et al. 2018).
Data Access: https://adaptwest.databasin.org/pages/distribution-and-protection-climatic-refugia.
Conservation Applications
Potential conservation applications of this dataset could include the following:
- This dataset can be used to anticipate locations that may function as climate refugia in the future, in that they harbor increasingly rare local climate conditions. The study that produced this dataset (Michalak et al., 2018) included an analysis of protected areas within North America and found that existing protected areas disproportionately included the projected climate refugia. A likely explanation for this is that climate refugia were disproportionately identified in high-elevation areas that are over-represented in protected area networks, because mountainous areas are more likely to be included in protected areas than lower-elevation, flat plains. However, a substantial number of predicted refugia sites remain unprotected and thus could be potential sites for future conservation investment.
Applicable scales for detailed spatial assessments:
- For conservation applications requiring detailed assessment of spatial variation of the dataset within a geographic boundary (such as a protected area), the following geographic scales may be most appropriate (see appendix 3 for more information).
- At the scale of: a Bureau of Land Management (BLM) district, a river watershed (8-digit hydrologic unit code [HUC-8]), an individual county, a national forest, a level-3 ecoregion (e.g. the North Cascades), a single state (Washington, Oregon, or Idaho), a region (multiple states in the Pacific Northwest or in western North America), the continental United States, the North American continent.
Applicable scales for assessing general patterns:
- Due to spatial resolution, the dataset may not show detailed spatial variation at the following geographic scales, however, the dataset may be useful to assess general patterns or for comparison to other locations (see appendix 3 for more information).
- At the scale of: a small (< 1 km2) nature preserve, a state park or state wildlife area, a local watershed (12-digit hydrologic unit code [HUC-12]).
Use of the dataset in conservation applications may be limited by the following considerations:
- Important components of species habitat were not included in this analysis, including soil, vegetation, and resource availability (e.g., food, nesting sites). In addition, because the study that produced this dataset did not incorporate landscape condition, species migration in areas of low landscape connectivity (e.g., urban or agricultural landscapes) might be considerably less than assumed based on the search radii (dispersal distances) in the analysis. Also, other possibly important types of refugia could exist on the landscape that are not represented in the dataset. These could include topographic microrefugia not detectable at the 1-km resolution of this dataset.
Past or current conservation applications:
- The dataset has not yet been used in any on-the-ground conservation applications to the knowledge of the authors of this chapter
Dataset citation:
Michalak, J. L., J. J. Lawler, D. R. Roberts, and C. Carroll. 2018. Distribution and protection of climatic refugia in North America. Conservation Biology 32: 1414–1425.
Dataset documentation link: https://doi.org/10.1111/cobi.13130 (open access)
Data access: The dataset can be downloaded from: https://adaptwest.databasin.org/pages/distribution-and-protection-climatic-refugia.
The dataset is not available for interactive online map viewing.
Metadata access: Formal metadata is not available for this dataset.
Dataset corresponding author:
Julia Michalak
School of Environmental and Forest Sciences, University of Washington
[email protected]
Data type category (as defined in the Introduction to this guidebook): Climate
Species or ecosystems represented: This dataset does not represent any individual species or ecosystems.
Units of mapped values: unitless
Range of mapped values: 1 = refugia; 0 = not identified as refugia
Spatial data type: a raster dataset (grid)
Data file format(s): GeoTiff (.tif)
Spatial resolution: 1 km
Geographic coordinate system: World Geodetic System (WGS) 1984
Projected coordinate system: World Geodetic System (WGS) 1984 Lambert Azimuthal Equal Area
Spatial extent: Continental (North America) excluding Central America and the Caribbean islands
Dataset truncation: The dataset is truncated along the border separating Mexico from Guatemala and Belize
Time period represented: Future (later than 2020)
Future time period(s) represented: Mid-century (2041-2070), end-of-century (2071-2100)
Baseline time period (against which future conditions were compared): 1961–1990.
Methods overview:
First, 10 biologically relevant climate variables were synthesized using Principal Components Analysis (PCA), such that the first two principal components represented multivariate climate conditions. Climate conditions in the baseline time period were compared to future time periods. For each pixel, climate analogs were identified as other pixels within a search radius having similar future climate conditions (i.e., differences less than a specified threshold value). In this analysis, "similar" was quantified using two different threshold values representing different niche breadths, with larger values corresponding to the concept of species with greater niche flexibility (i.e., climatic differences between pixels were allowed to be greater while being labelled "similar") and conversely smaller values representing less niche flexibility (requiring less climate difference to be considered "similar"). In this analysis, several search radii were used, representing different possible annual dispersal distances: 0.5, 1, 5, and 10 km. These annual distances were multiplied by the number of years between the reference and future time period to determine the final search radius. Pixels were identified as refugia if the projected future climatic conditions at the pixel’s location were rare relative to their historical extent within the given search radius. Data layers representing refugia are available for eight generic species types (two values of niche flexibility multiplied by four dispersal distances) and for all generic species types combined (in which a pixel was identified as a refugium if it was a refugium for at least one of the eight generic types). For more information, please consult the dataset citation listed in section 2 of this chapter.
Major input data sources for this dataset included: Species ranges or point locations, historical climate observations or models, future climate projections
This dataset used the following general circulation models (GCMs): GFDL-CM3, MIROC5, INM-CM4
Separate files are provided for each GCM; no ensemble is provided across GCMs. More information about climate models is available in appendix 1. Detailed information about climate models, including model evaluation and comparison among models, is available from Randall et al. (2007) and Rupp et al. (2013).
This dataset used the following greenhouse-gas scenarios: RCP 8.5
More information about greenhouse-gas scenarios is available in appendix 2 and from Knutti and Sedláček (2013).
Creation of this dataset involved the following methods to change the spatial resolution of climate models (e.g. to downscale or resample climate models):
Climate data were downscaled using ClimateNA software version 5.10 (Wang et al., 2016).
The mapped values of the dataset may be interpreted as follows:
Pixels coded 1 indicate refugia, defined as locations with increasingly rare climate conditions within a given search radius (dispersal distance). Pixels coded 0 are non-refugia.
Representations of key concepts in climate-change ecology:
This dataset primarily represents climate-change exposure, in that the existence of climate analogs within a given search radius is a function of the degree and magnitude of climate change. Because various search radii and niche breadth values were considered, this analysis also incorporated ideas of climate sensitivity, by using two different thresholds to define “similar” climatic conditions. This analysis also incorporates adaptive capacity, by measuring species’ abilities to migrate (track changing climate conditions by dispersing across the landscape) and/or shift their habitat-utilization patterns (exploit new habitats with similar but not identical climate conditions).
Additionally, this dataset contributes to the growing analysis of various kinds of climatic refugia. Refugia from climate change have been identified by different research teams using different definitions, approaches, and scales of analysis. However, refugia identification generally seeks to find locations that provide relatively rare opportunities for species persistence and/or adaptation under changing climate conditions. Relatively large-scale macrorefugia, as presented in this dataset, may be considered along with finer-scale microrefugia (such as could be provided in areas of diverse microclimates due to diverse local topography) to assess the potential for a given area to support species’ persistence or adaptation.
This dataset involves the following assumptions, simplifications, and caveats:
Although landscape connectivity is considered important to allow species to track changing climate conditions, the analysis that produced this dataset did not account for landscape conditions and instead used a fixed dispersal distance regardless of possible barriers to species movement. In addition, this analysis represented habitat using climate conditions only, and did not incorporate other important determinants of habitat quality and location such as soils, vegetation, and resource availability.
Quantification of uncertainty:
Refugia were identified and compared across three general circulation models (GCMs), corresponding to various magnitudes of projected climate change.
Field verification:
Field verification of the mapped values in this dataset was not possible because the dataset represents a future condition. Datasets representing the baseline time period were derived from downscaled climate grids from the ClimateNA dataset (Wang et al. 2016). Accuracy of the baseline climate variables in the ClimateNA dataset was assessed using monthly mean observations from 4,891 weather stations across North America, located predominantly in the United States; see table 2 in Wang et al. (2016).
Prior to dataset publication, peer review was conducted by external review (at least two anonymous reviewers, each from a different institution).
Knutti, R., and J. Sedláček. 2013. Robustness and uncertainties in the new CMIP5 climate model projections. Nature Climate Change 3:369–373.
Michalak, J. L., J. J. Lawler, D. R. Roberts, and C. Carroll. 2018. Distribution and protection of climatic refugia in North America. Conservation Biology 32: 1414–1425.
Randall, D., R. Wood, S. Bony, R. Colman, T. Fichefet, J. Fyfe, V. Kattsov, et al. 2007. Cilmate models and their evaluation. in S. Solomon, D. Qin, M. Manning, Z. Chen, M. Marquis, K. Averyt, M. Tignor, and H. Miller, editors. Climate Change 2007: The Physical Science Basis. Contribution of Working Group I to the Fourth Assessment Report of the Intergovernmental Panel on Climate Change. Cambridge University Press, New York, NY.
Rupp, D. E., J. T. Abatzoglou, K. C. Hegewisch, and P. W. Mote. 2013. Evaluation of CMIP5 20th century climate simulations for the Pacific Northwest USA. Journal of Geophysical Research 118: 884–907.
Wang, T., A. Hamann, D. Spittlehouse, and C. Carroll. 2016. Locally downscaled and spatially customizable climate data for historical and future periods for North America. PLoS One 11:e0156720.